Julia’s First Tiles
Hand-drawn
First Tile
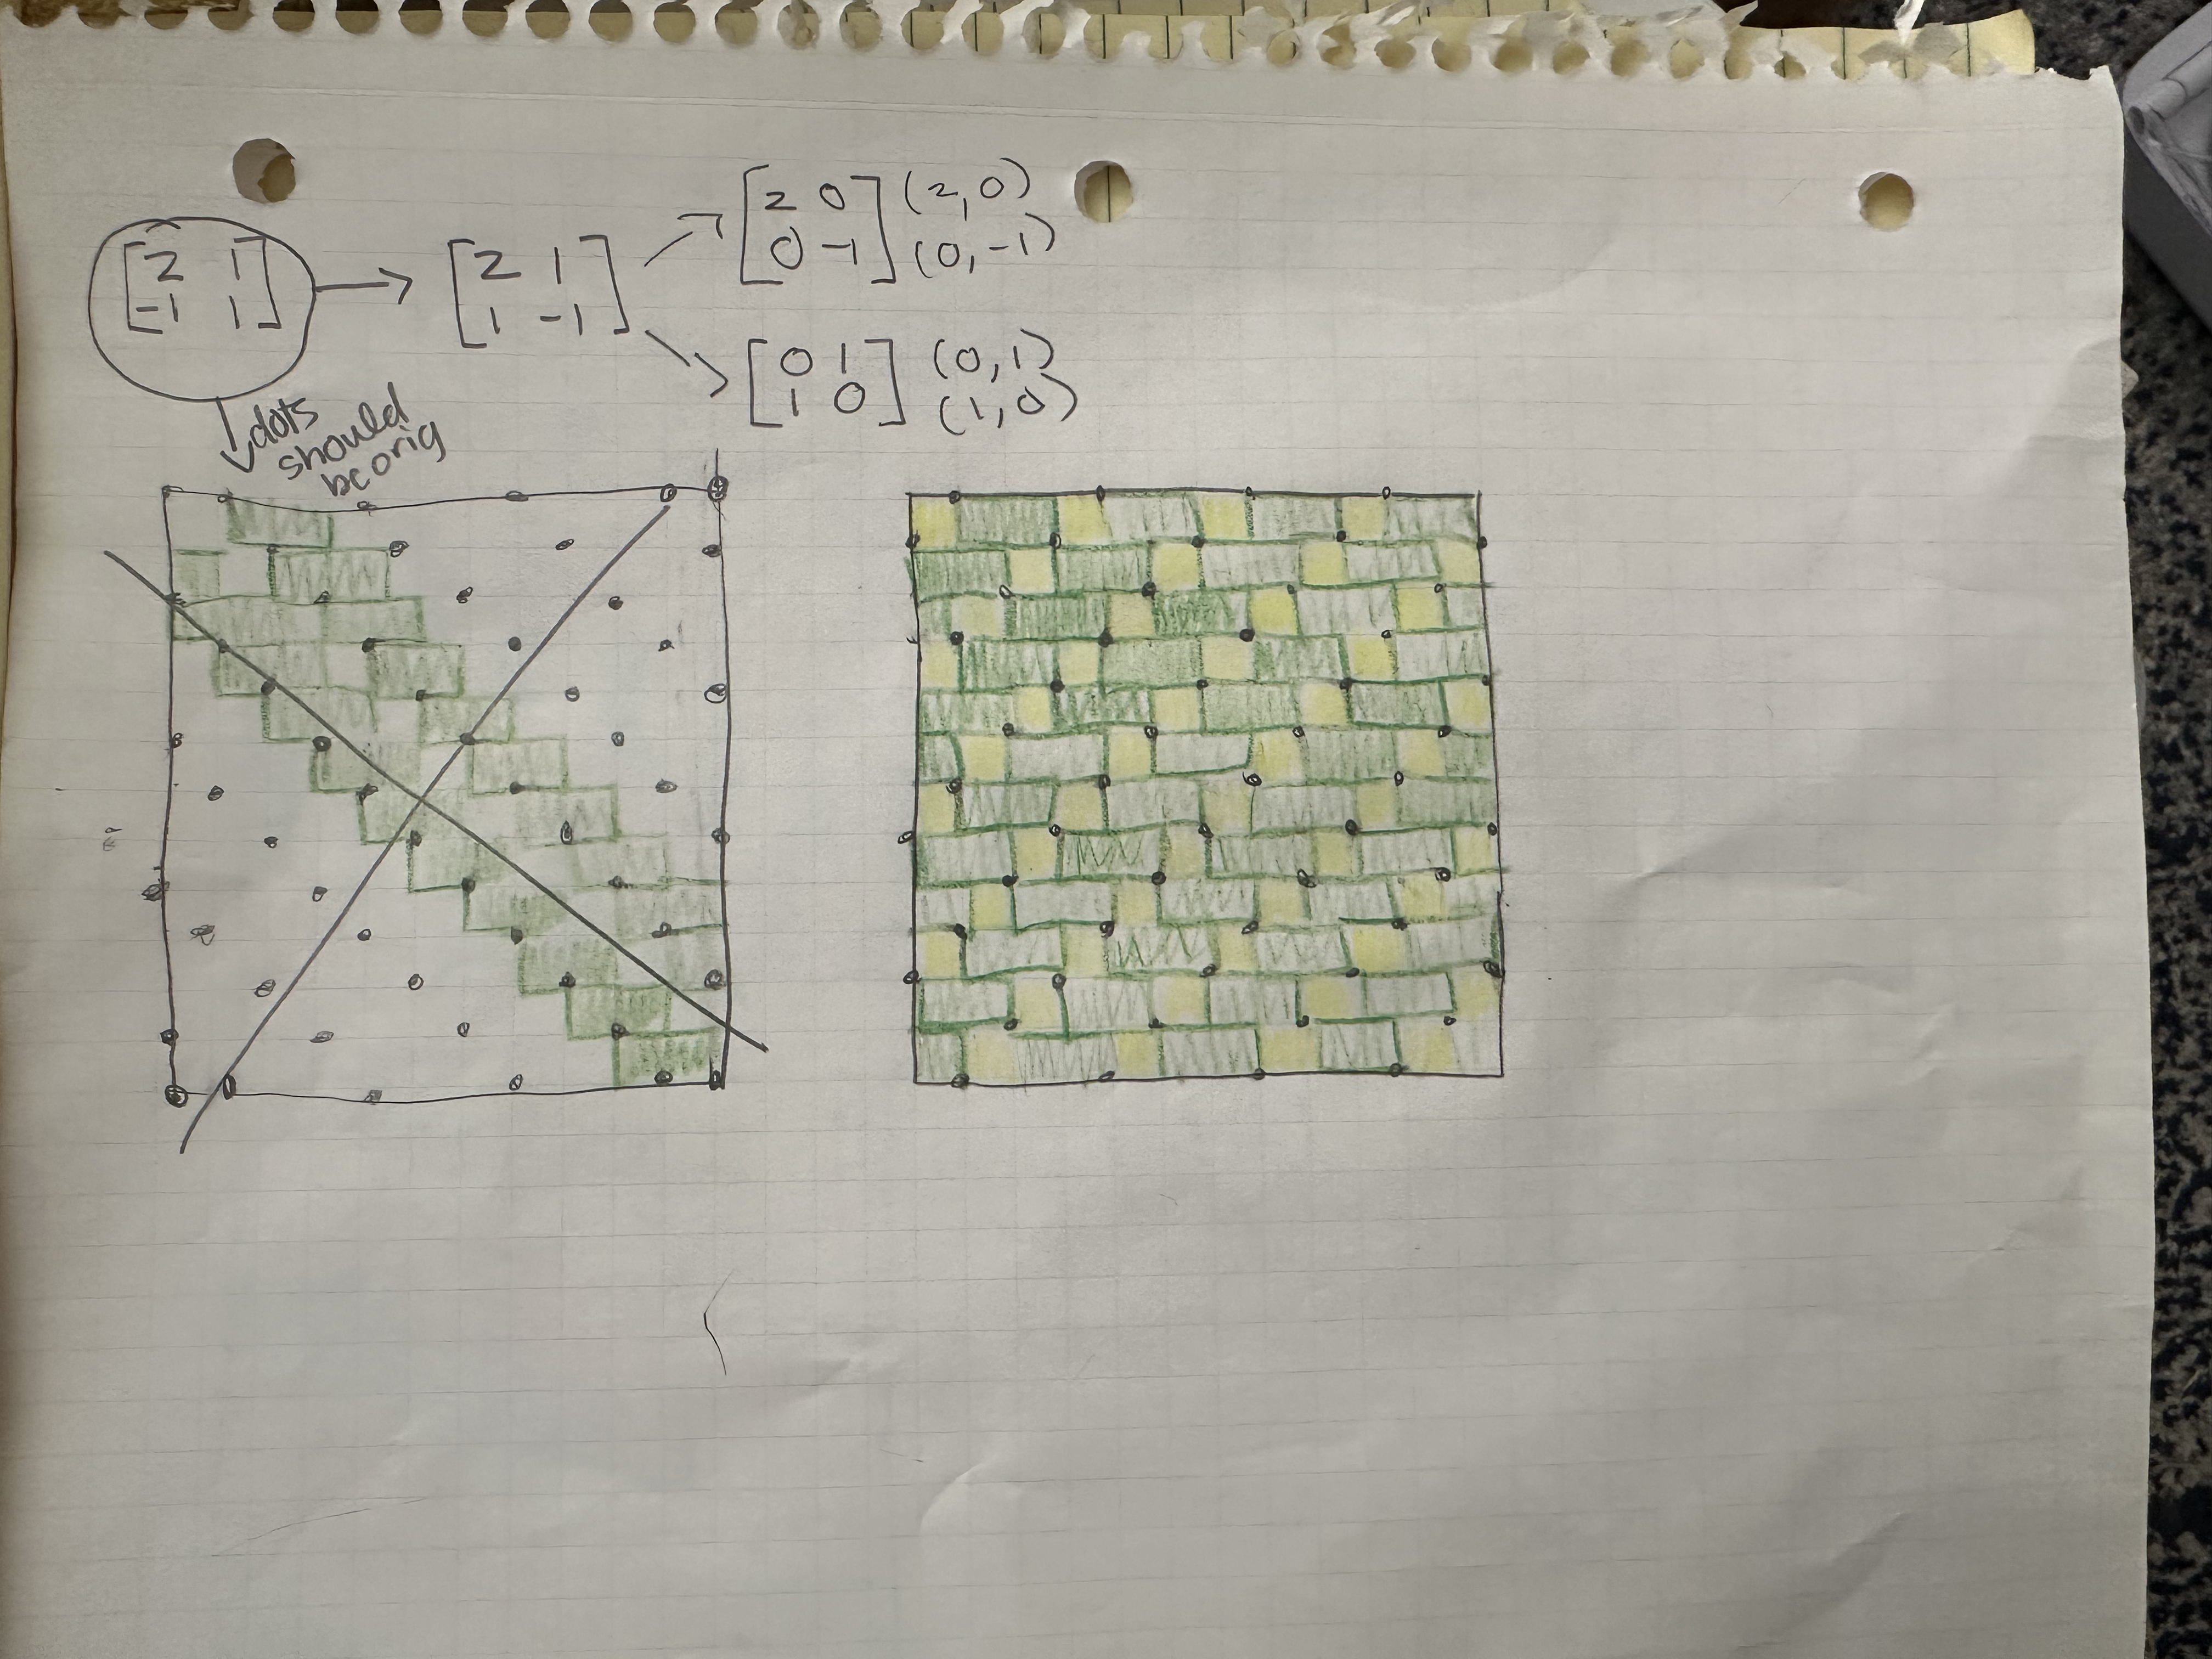
\[ M = \begin{bmatrix}2 & 1\\ -1 & 1\end{bmatrix} \]
Second Tile
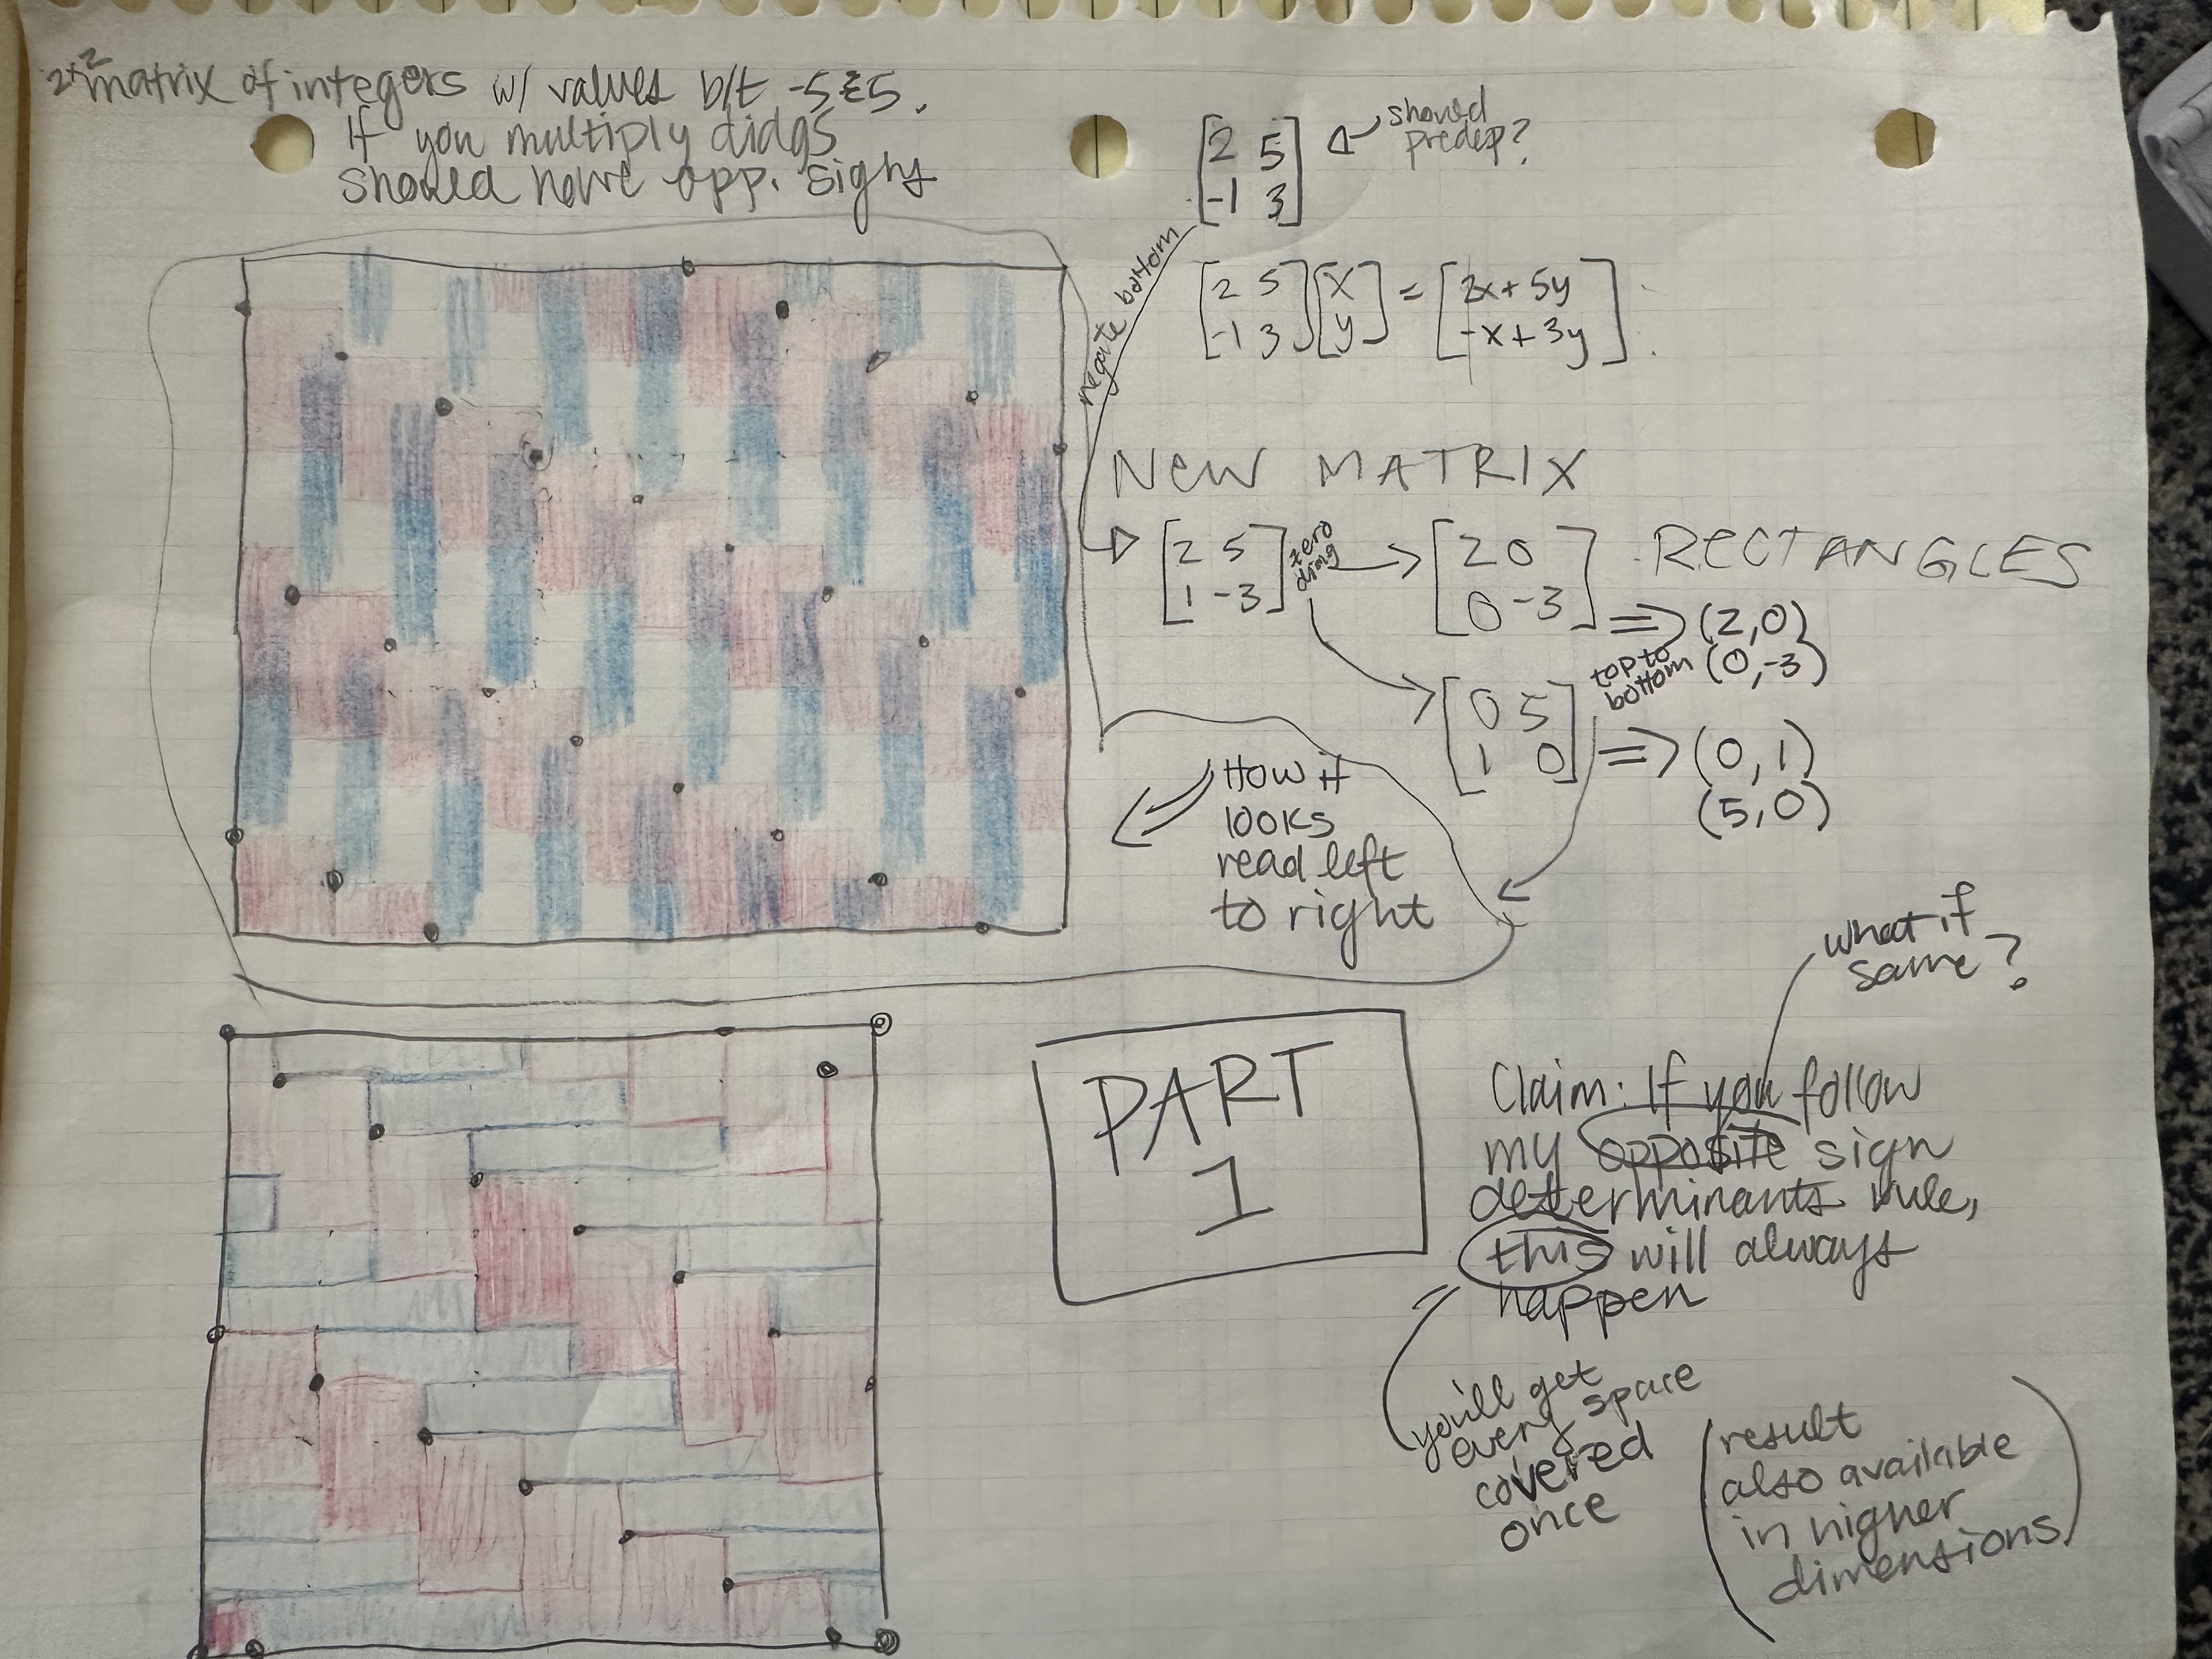
\[ M = \begin{bmatrix} 2 & 5\\ -1 & 3\end{bmatrix} \]
Third Tile
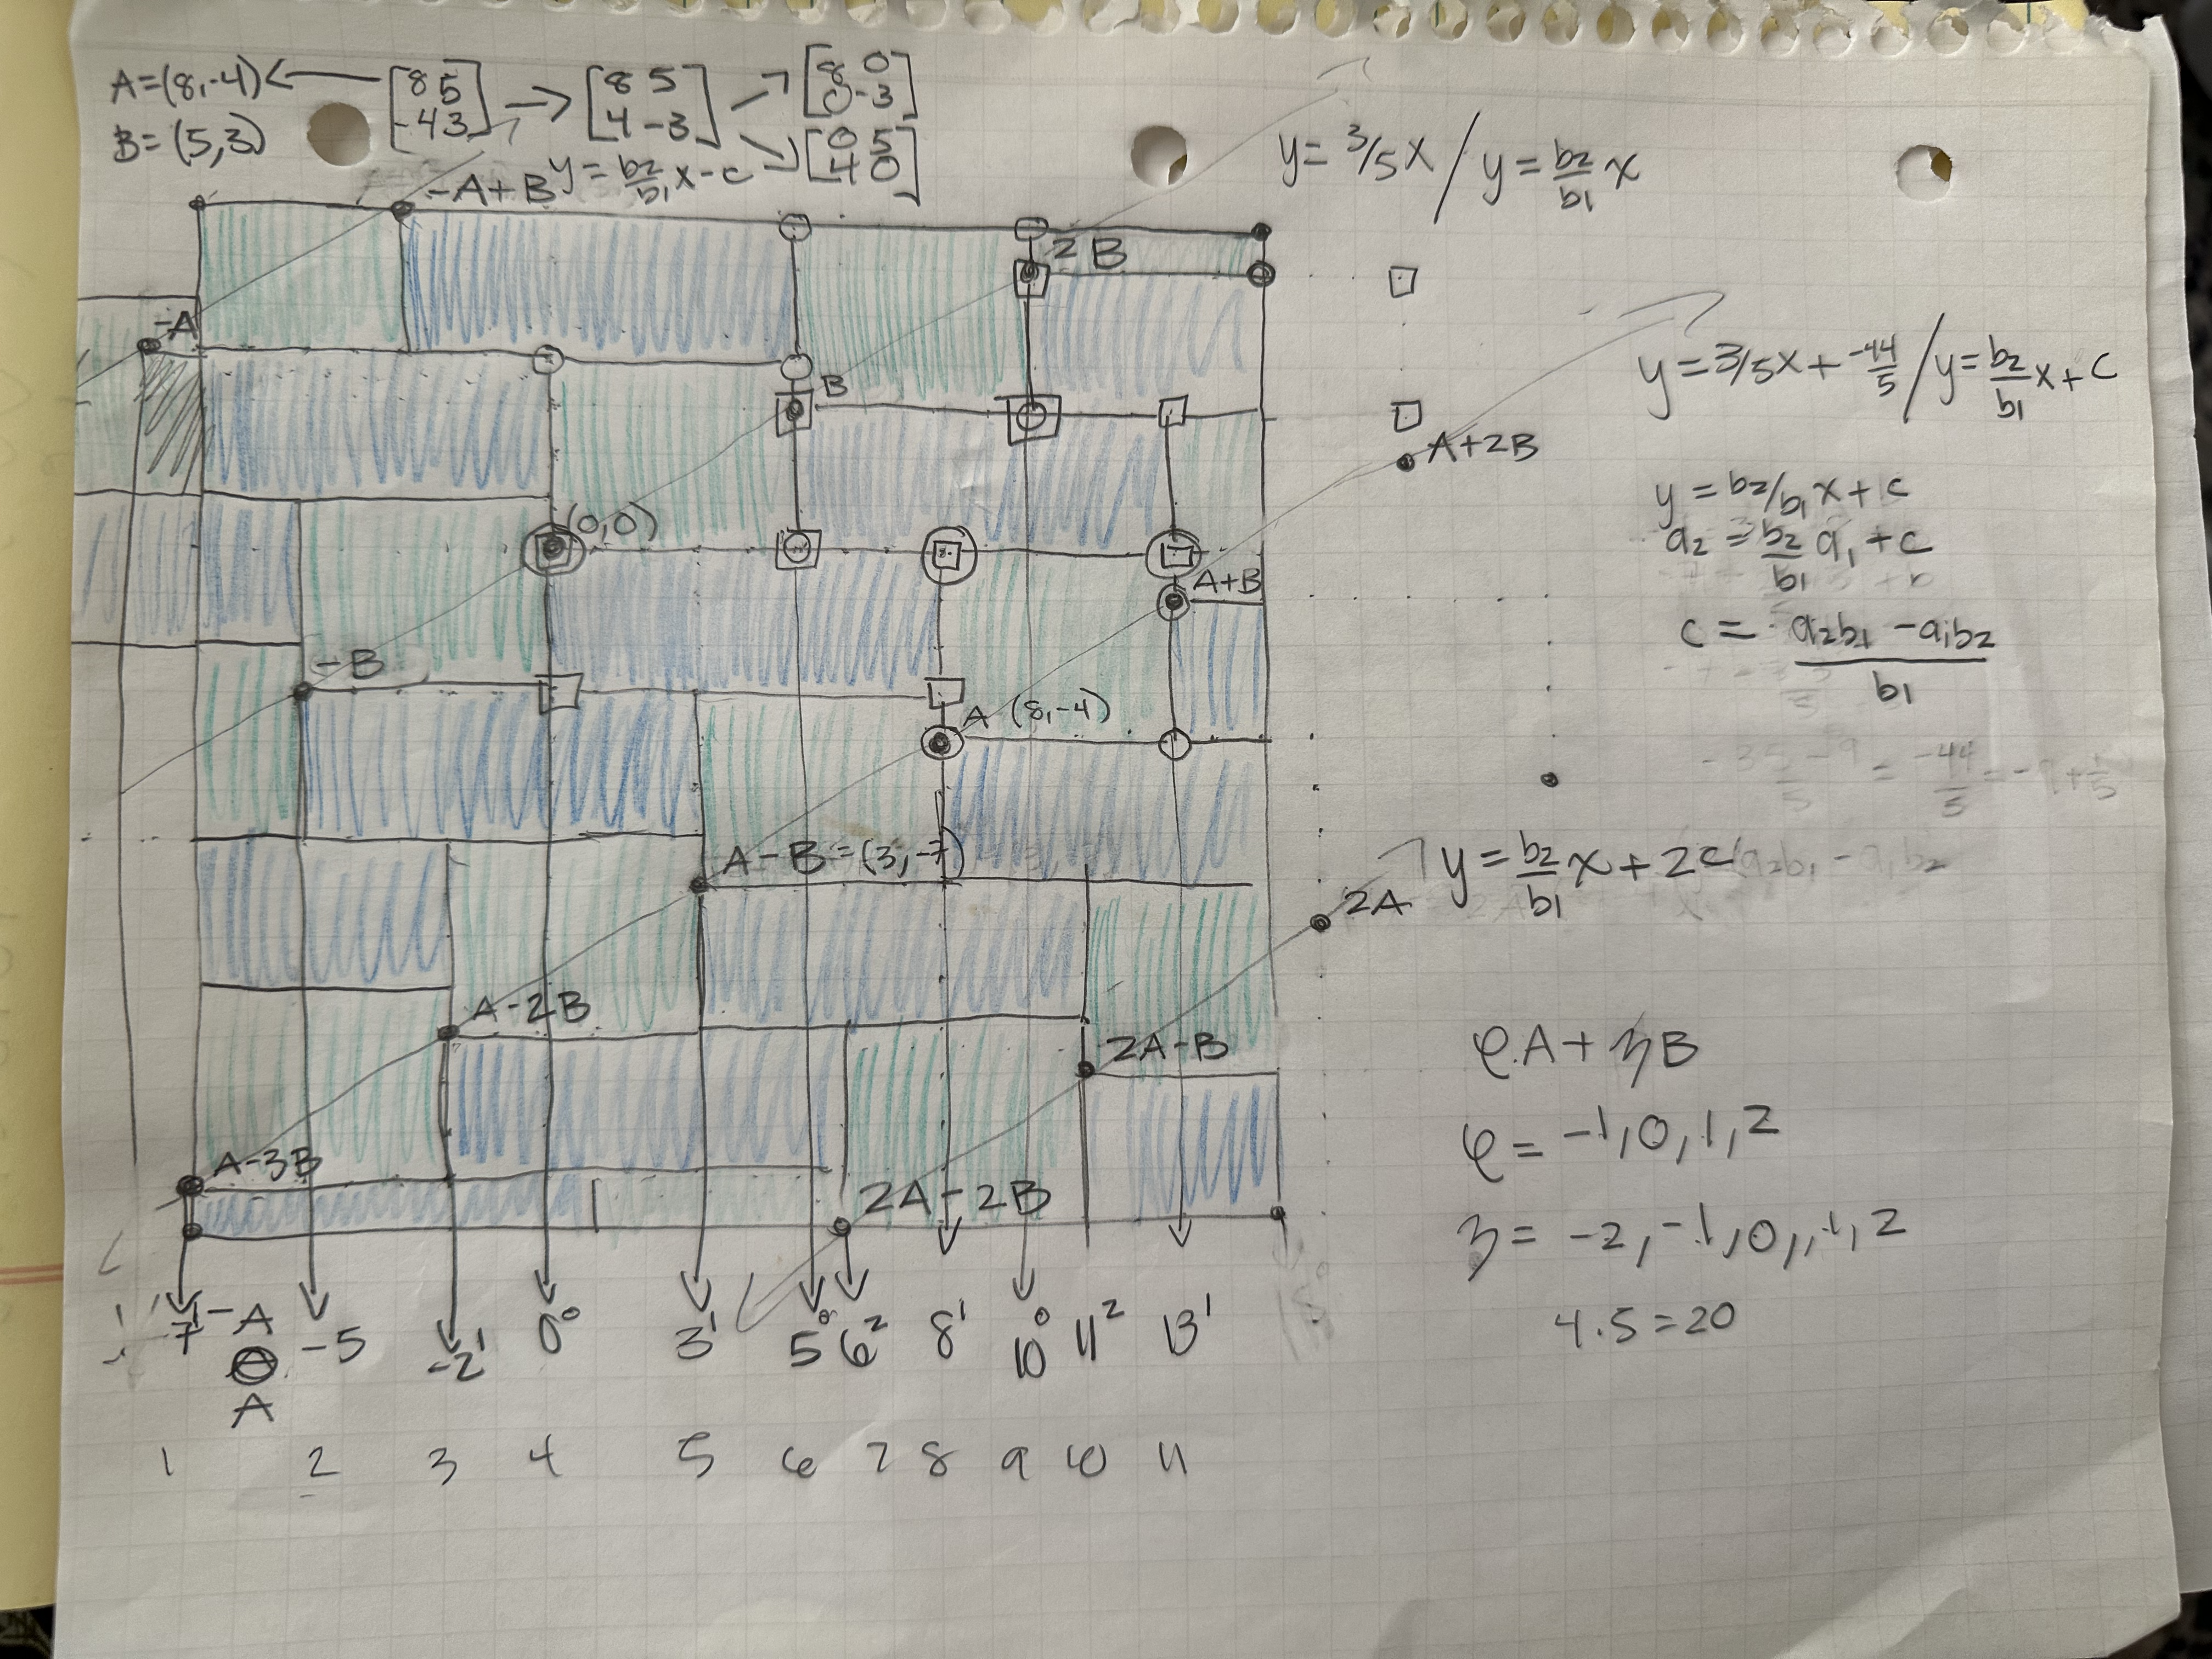
\[ M = \begin{bmatrix} 8& 5\\ -4 & 3\end{bmatrix} \]
Computer-generated
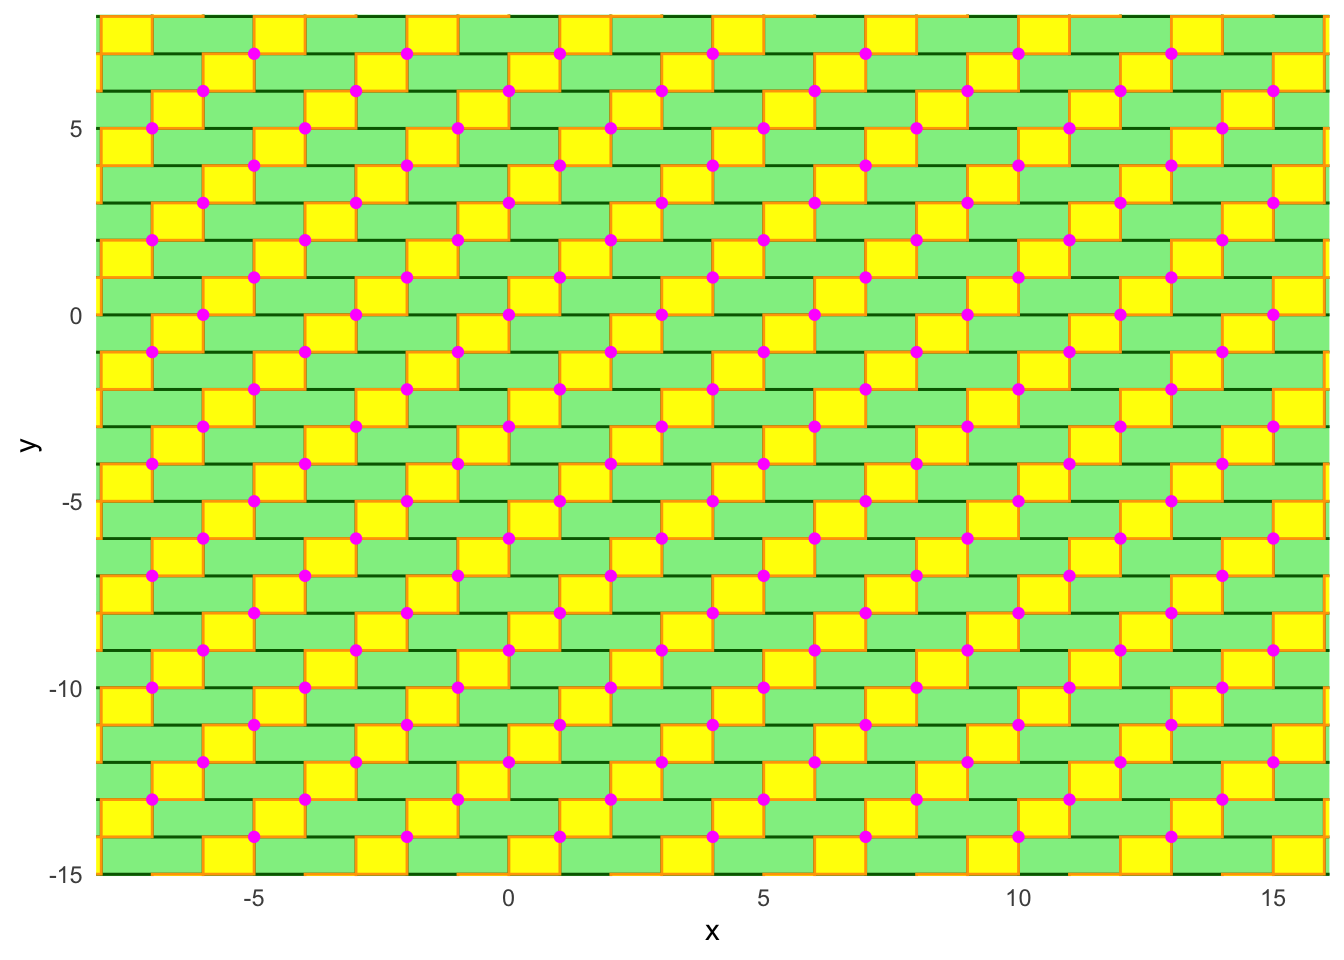
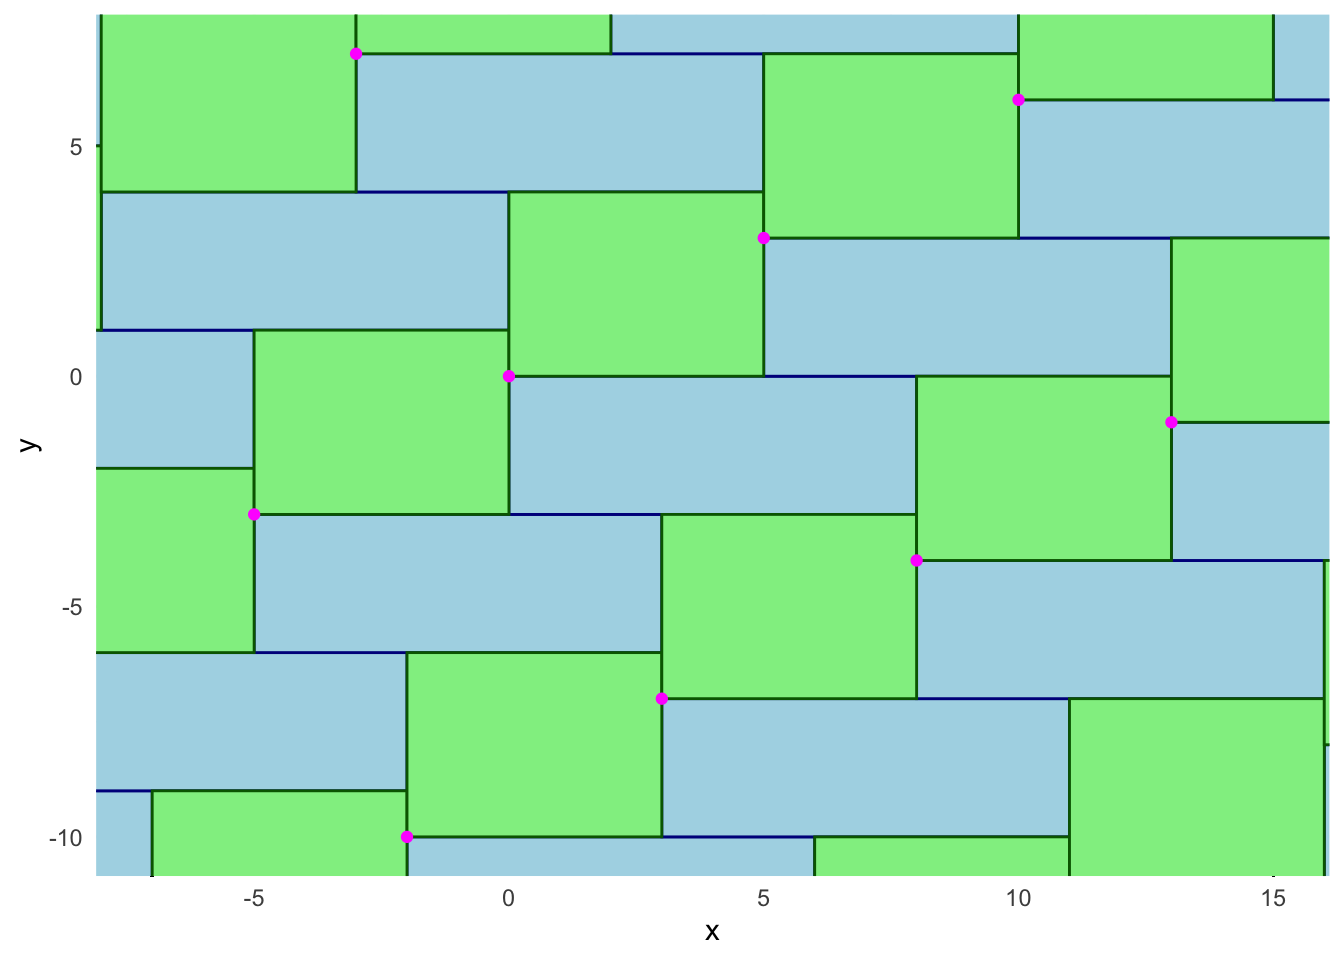
Fourth Tile
\[ M = \begin{bmatrix} 3 & 3\\ -3 & 3\end{bmatrix} \]
Code
library(ggplot2)
## original coordinates
A <- matrix(c(3, -3), ncol = 1)
B <- matrix(c(3, 3), ncol = 1)

## coordinates for 4 copies/combos
copies <- -10:10
coefs <- expand.grid(copies, copies)

x.coords <- coefs$Var1*A[1] + coefs$Var2*B[1]
y.coords <- coefs$Var1*A[2] + coefs$Var2*B[2]

plot.dat <- data.frame(x = x.coords, y = y.coords)
p <- ggplot(data = plot.dat, aes(x = x, y = y)) +
    geom_point() +
    ylim(c(-14, 7)) +
    xlim(c(-7, 15)) +
    geom_rect(xmin = -7, xmax = 15, ymin = -14, ymax = 7,
                        fill = "#FFFFFF00", col = "black") +
    theme_minimal()


## could fix the grid to make these for printing!

## create on-diag rectangles
p1 <- p + geom_rect(xmin = plot.dat$x, xmax = plot.dat$x + A[1],
                            ymin = plot.dat$y, ymax = plot.dat$y - B[2],
                            fill = "lightpink", col = "pink") +
    ylim(c(-10, 7)) +
    xlim(c(-7, 15))
## create off-diag rectangles
p2 <- p1 + geom_rect(xmin = plot.dat$x, xmax = plot.dat$x + B[1],
                            ymin = plot.dat$y, ymax = plot.dat$y - A[2],
                            fill = "lavender", col = "purple")
p2 + geom_point(col = "magenta")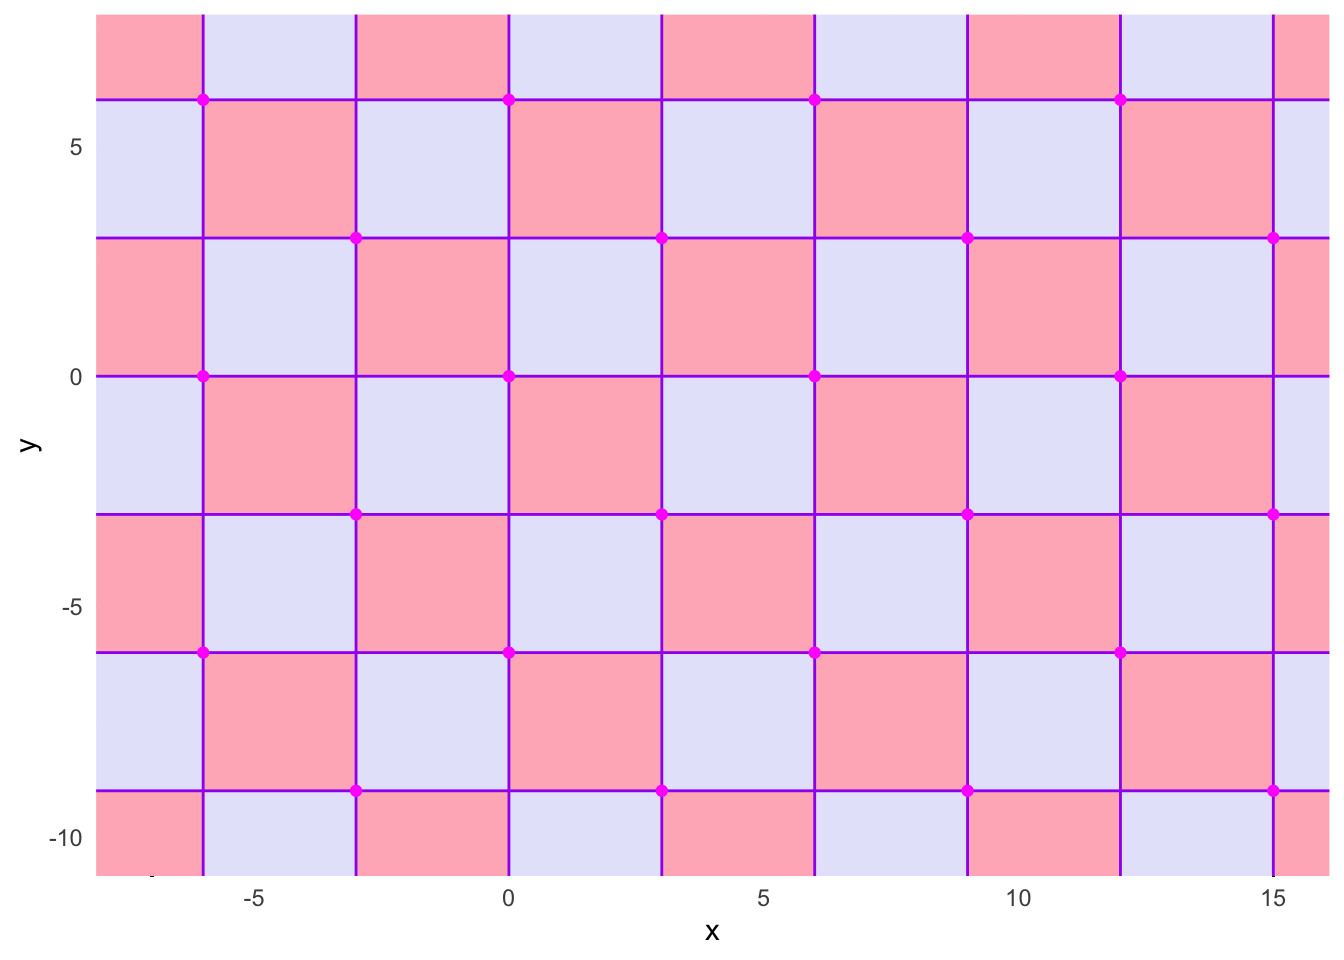
Fifth Tile
\[ M = \begin{bmatrix} 12& 6\\ -3 & 1\end{bmatrix} \]
Code
library(ggplot2)
## original coordinates
A <- matrix(c(12, -3), ncol = 1)
B <- matrix(c(6, 1), ncol = 1)

## coordinates for 4 copies/combos
copies <- -10:10
coefs <- expand.grid(copies, copies)

x.coords <- coefs$Var1*A[1] + coefs$Var2*B[1]
y.coords <- coefs$Var1*A[2] + coefs$Var2*B[2]

plot.dat <- data.frame(x = x.coords, y = y.coords)
p <- ggplot(data = plot.dat, aes(x = x, y = y)) +
    geom_point() +
    ylim(c(-14, 7)) +
    xlim(c(-7, 15)) +
    geom_rect(xmin = -7, xmax = 15, ymin = -14, ymax = 7,
                        fill = "#FFFFFF00", col = "black") +
    theme_minimal()


## could fix the grid to make these for printing!

## create on-diag rectangles
p1 <- p + geom_rect(xmin = plot.dat$x, xmax = plot.dat$x + A[1],
                            ymin = plot.dat$y, ymax = plot.dat$y - B[2],
                            fill = "lightpink", col = "darkred") +
    ylim(c(-10, 7)) +
    xlim(c(-7, 15))
## create off-diag rectangles
p2 <- p1 + geom_rect(xmin = plot.dat$x, xmax = plot.dat$x + B[1],
                            ymin = plot.dat$y, ymax = plot.dat$y - A[2],
                            fill = "#E0FFFF", col = "#A2FFFF")
p2 + geom_point(col = "magenta")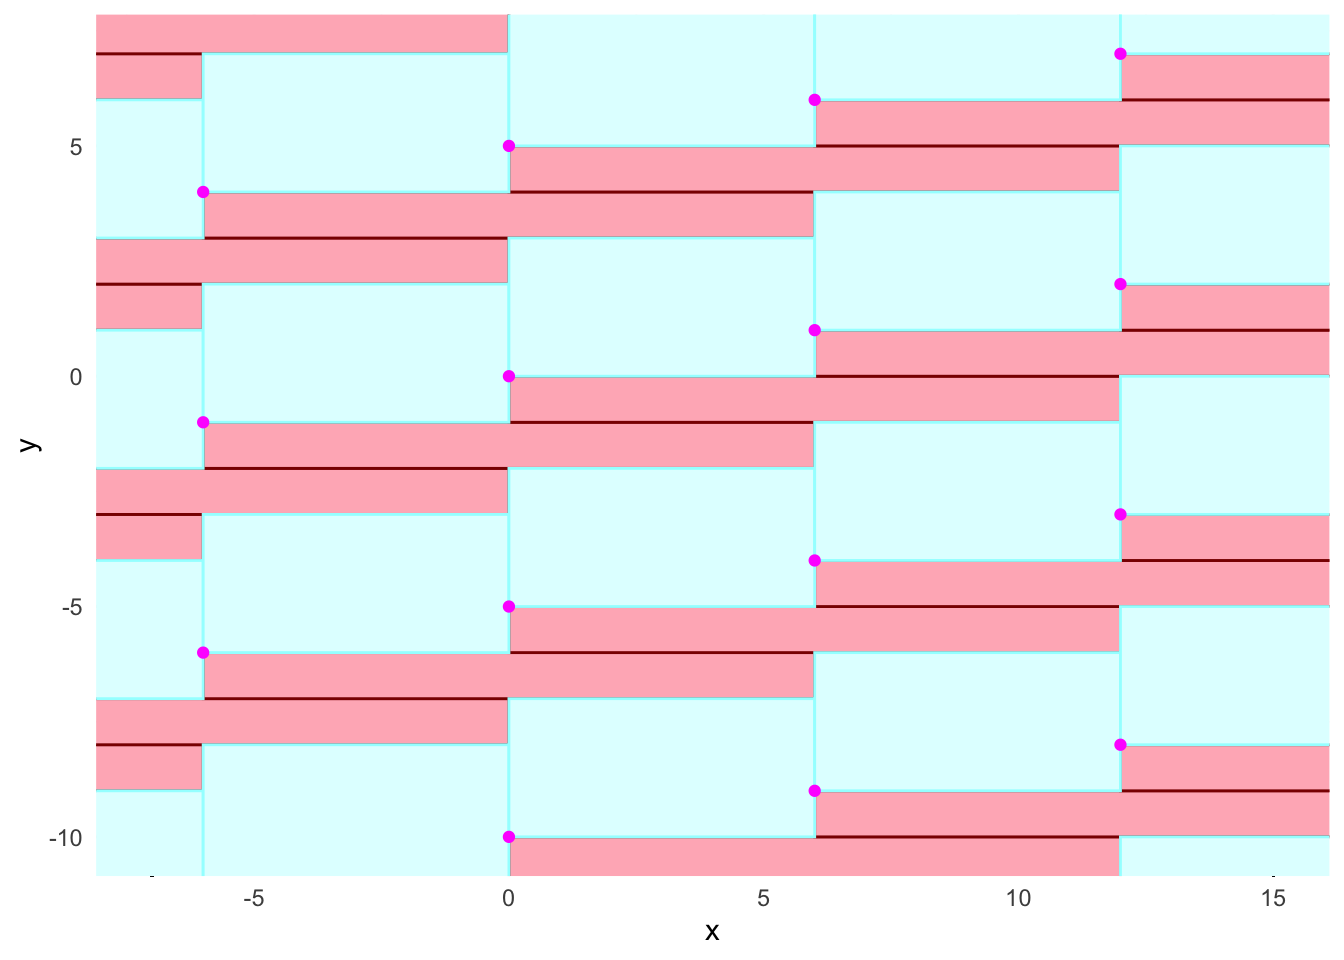
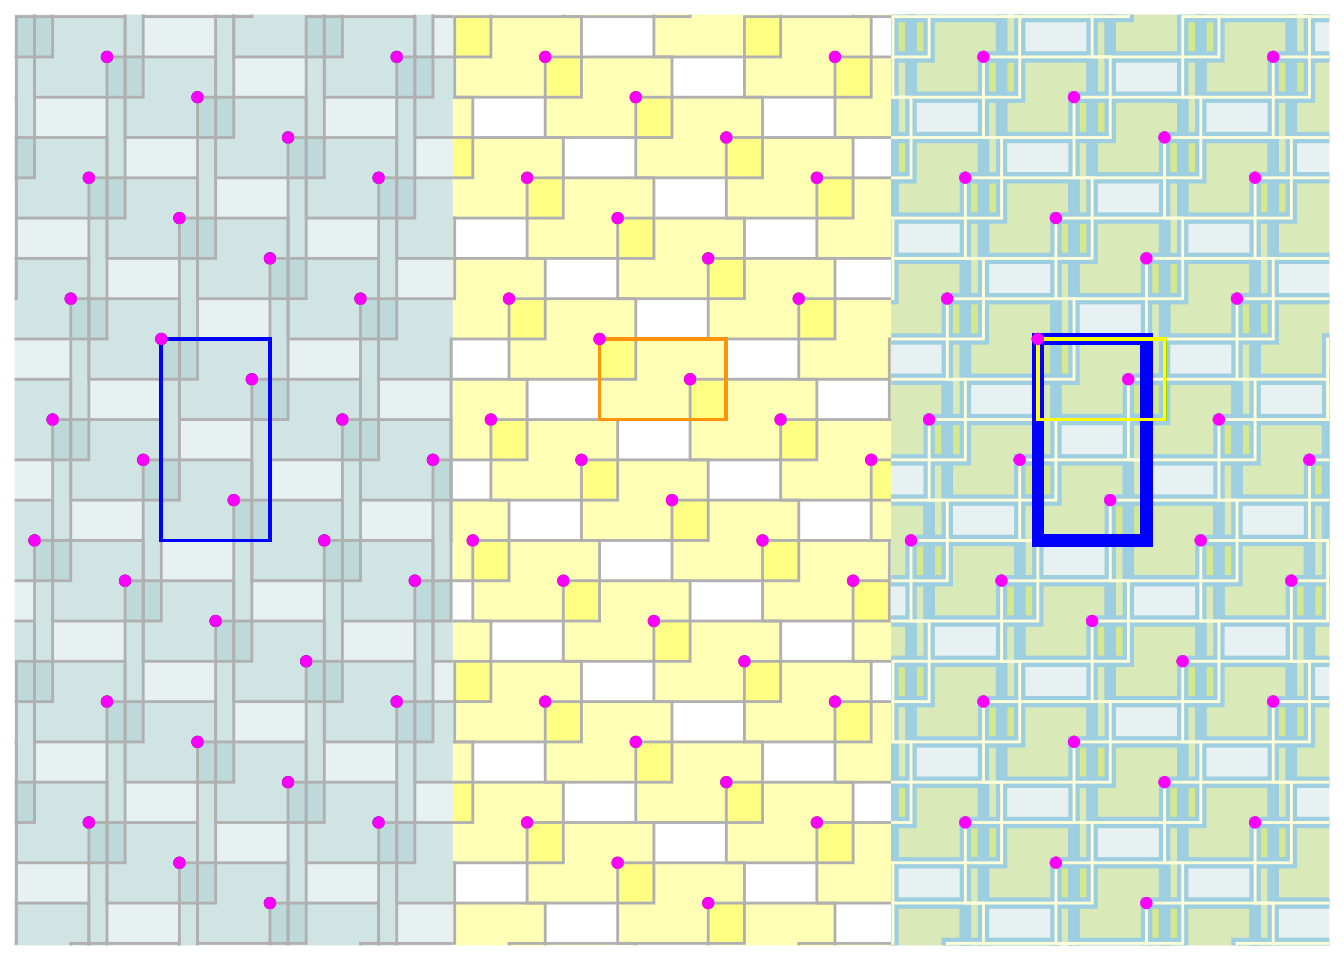
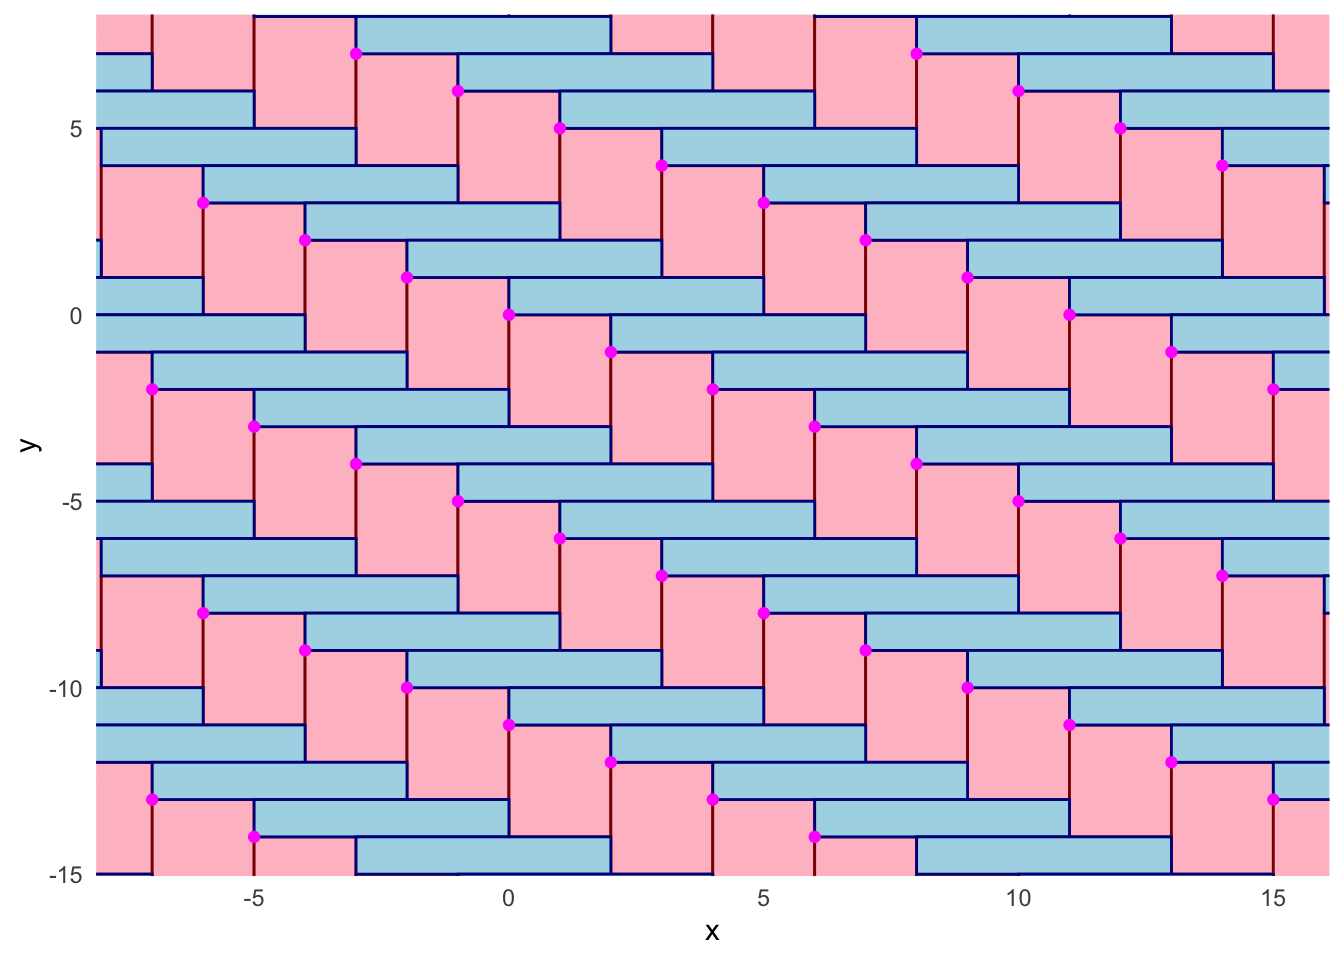
Sixth tile
Code
library(ggplot2)
## original coordinates
A <- matrix(c(7, 5), ncol = 1)
B <- matrix(c(6, 2), ncol = 1)

## coordinates for 4 copies/combos
copies <- -15:15
coefs <- expand.grid(copies, copies)

x.coords <- coefs$Var1*A[1] + coefs$Var2*B[1]
y.coords <- coefs$Var1*A[2] + coefs$Var2*B[2]

plot.dat <- data.frame(x = x.coords, y = y.coords)
p <- ggplot(data = plot.dat, aes(x = x, y = y)) +
    geom_point() +
    ylim(c(-14, 7)) +
    xlim(c(-7, 15)) +
    # geom_rect(xmin = -7, xmax = 15, ymin = -14, ymax = 7,
    #                   fill = "#FFFFFF00", col = "black") +
    theme_void()


## could fix the grid to make these for printing!

## create on-diag rectangles
p1 <- p +geom_rect(xmin = plot.dat$x, xmax = plot.dat$x + B[1],
                            ymin = plot.dat$y, ymax = plot.dat$y - A[2],
                            fill = "#008b8b", alpha = .1) +
                            geom_rect(xmin = plot.dat$x, xmax = plot.dat$x + B[1],
                            ymin = plot.dat$y, ymax = plot.dat$y - A[2],
                            fill = "#FFFFFF00", col = "grey") +
                            geom_rect(xmin = plot.dat$x[481], xmax = plot.dat$x[481] + B[1],
                            ymin = plot.dat$y[481], ymax = plot.dat$y[481] - A[2],
                            fill = "#FFFFFF00", col = "blue") +
                            geom_point(col = "magenta") +
                            ylim(c(-14, 7)) +
                            xlim(c(-7, 15))


library(patchwork)
p2 <- p + geom_rect(xmin = plot.dat$x, xmax = plot.dat$x + A[1],
                            ymin = plot.dat$y, ymax = plot.dat$y - B[2],
                            fill = "yellow", alpha = .3) +
                            geom_rect(xmin = plot.dat$x, xmax = plot.dat$x + A[1],
                            ymin = plot.dat$y, ymax = plot.dat$y - B[2],
                            fill = "#FFFFFF00", col = "grey") +
                            geom_rect(xmin = plot.dat$x[481], xmax = plot.dat$x[481] + A[1],
                            ymin = plot.dat$y[481], ymax = plot.dat$y[481] - B[2],
                            fill = "#FFFFFF00", col = "orange")+
                            geom_point(col = "magenta")+
                            ylim(c(-14, 7)) +
                            xlim(c(-7, 15))

## create off-diag rectangles
p_both <- p1 +  geom_rect(xmin = plot.dat$x, xmax = plot.dat$x + A[1],
                            ymin = plot.dat$y, ymax = plot.dat$y - B[2],
                            fill = "yellow", alpha = .2) +
                            ## outlines
                            geom_rect(xmin = plot.dat$x, xmax = plot.dat$x + B[1],
                            ymin = plot.dat$y, ymax = plot.dat$y - A[2],
                            fill = "#FFFFFF00", col = "lightblue", lwd = 2) +
                            geom_rect(xmin = plot.dat$x, xmax = plot.dat$x + A[1],
                            ymin = plot.dat$y, ymax = plot.dat$y - B[2],
                            fill = "#FFFFFF00", col = "lightyellow") +
                            geom_rect(xmin = plot.dat$x[481], xmax = plot.dat$x[481] + B[1],
                            ymin = plot.dat$y[481], ymax = plot.dat$y[481] - A[2],
                            fill = "#FFFFFF00", col = "blue", lwd = 2) +
                            geom_rect(xmin = plot.dat$x[481], xmax = plot.dat$x[481] + A[1],
                            ymin = plot.dat$y[481], ymax = plot.dat$y[481] - B[2],
                            fill = "#FFFFFF00", col = "yellow") +
                            geom_point(col = "magenta") +
                            ylim(c(-14, 7)) +
                            xlim(c(-7, 15))
## add edges after
p1 + p2 + p_both